The availability of transit to enable travelers to reach key destinations is an important aspect of accessibility. This measure is evaluated by examining the presence of transit service, the frequency of service and the density of jobs and population within close proximity to transit stops. Depending on the location and needs of the study, the term ‘transit’ can apply to fixed route transit, paratransit, vanpools, or other forms of shared ride services. Note that pedestrian and bicyclist access to transit stops should be included for full analysis of transit service availability.
| PERFORMANCE MEASURE | PERFORMANCE METRICS | PROJECT TASKS | APPROPRIATE CONTEXTS |
|---|---|---|---|
| Transit Facility Availability & Connectivity | Presence of local transit/regional service | Identify Needs Assess Alternative Strategies Assign Resources | Urban Core Town/Urban Suburban Rural* |
| Population/jobs within 1/2 mile of transit stop | Refine Solutions Assign Resources | Urban Core Town/Urban Suburban* |
|
| Frequency of transit service | Assess Alternative Strategies Refine Solutions | Urban Core Town/Urban Suburban* Rural* |
|
| *sometimes applicable, refer to metric description for more information | |||
- What? A measure of transit service availability at the local and regional level.
- Why? Presence of transit service provides travel options to reach key destinations. Also, design of roadway facilities should take transit services into account in order to enable transit to operate efficiently.
- Where? This measure examines the transit network within a defined area around a corridor or study area, although it could also be applied at a system level. Most applications would be in urban or suburban settings where transit service already exists, although it could also be applied in rural settings where new transit service is being considered.
- How? Coordinate with local transit agencies to identify the relevant transit routes and service types. Some data on transit stop locations can be downloaded from the WSDOT GeoData Distribution Catalog.
| METRIC | SOURCES | DATA | ANALYSIS SOFTWARE | CALCULATION | RESOURCES |
|---|---|---|---|---|---|
| Presence of local transit/regional service | Local transit provider data WSDOT GeoData Distribution Catalog | Transit stop and route data | GIS program Spreadsheet inventories | Evaluate presence or absence of transit service | Transit agency data WSDOT GeoData Distribution Catalog |
Case Study: Shoreline, WA 145th Street Multimodal Corridor Study (2016)
The presence of transit, both local service and regional service, can be a key indicator of how a project or corridor provides access for different users. The presence of transit is often wrapped up in other transit related metrics- if the frequency or reliability of transit is included as a metric, it is then evident that the presence of service is accounted for. In the City of Shoreline’s 145th Street Multimodal Corridor Study the presence of local and regional transit is evaluated using other transit evaluation criteria (transit speed, reliability, and access.
To learn more, visit the project website for the 145th Street Multimodal Corridor Study.
- What? The quantity of population and jobs proximate to transit stops (i.e., within walking distance).
- Why? Transit stops that are close to homes and jobs provide better access for transit users and are more likely to be used.
- Where? This metric is typically used for corridor and subarea studies in urban and suburban settings where transit is available. It could also be used to compare the tradeoffs between providing a ”lifeline” transit service to rural and suburban areas versus providing more frequent service in denser areas.
- How? Show transit network, transit stops, and population/jobs located within a 1/2-mile walking distance. Some data on transit stop locations can be downloaded from the WSDOT GeoData Distribution Catalog. The analysis can be refined by specifying a threshold of transit service provided (e.g. frequent transit based on headways, all-day vs. peak-only transit).
This metric can be calculated with Cube Access using similar data to the Access to Jobs metric. However, it lacks the origin-to-destination knowledge built into the access to jobs analysis. The advantage of the simpler metric described here is that it can be easily calculated using any GIS program and land use shapefiles available from local agencies.
| METRIC | SOURCES | DATA | ANALYSIS SOFTWARE | CALCULATION | RESOURCES |
|---|---|---|---|---|---|
| Population/jobs within 1/2 mile of transit stop | Local population data Transit agency data WSDOT GeoData Distribution Catalog | Transit network Local or Census population and jobs data Land use inventory at parcel or grid level Future land use forecasts | GIS program Sugar Access | Calculate population (or households) and jobs within 1/2 mile of transit stops | Sugar Access GIS program Transit agency data WSDOT GeoData Distribution Catalog |
Case Study: Fort Collins (CO) Transit Master Plan (2019)
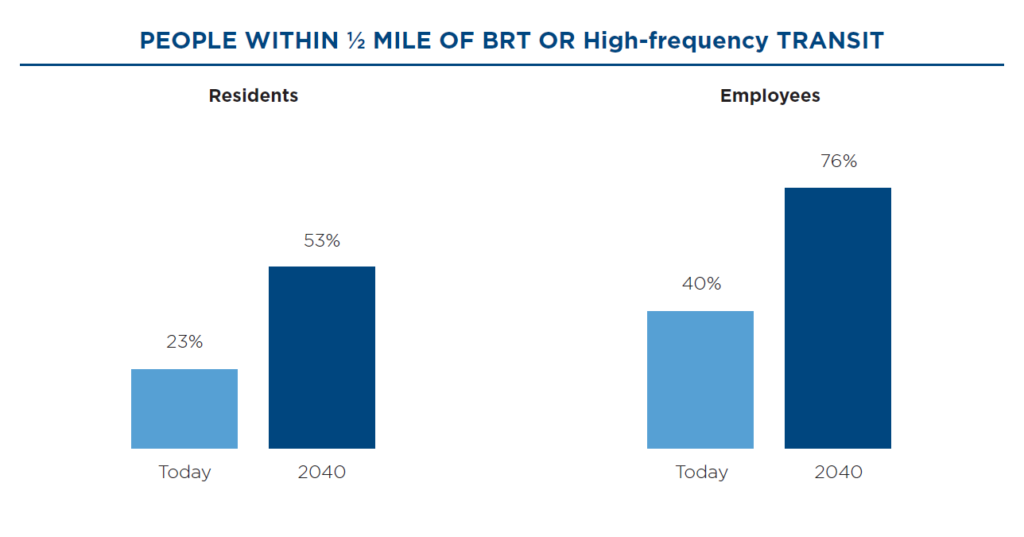
Population and number of jobs within ½ mile, or other set distance, of a transit stop can be a key indicator of how accessible transit is for different users. This metric can have variations depending on the project type. For example, Fort Collins Transit Master Plan (2019) prioritizes high-frequency transit coverage – the number of employees with high-frequency transit within a half mile of their work, and the number of residents with high-frequency transit within a half mile of home. Coverage for all types of transit will remain about the same as it is today, but coverage of high-frequency transit will increase as a result of this plan.
To learn more, please see the final report for the Fort Collins Transit Master Plan.
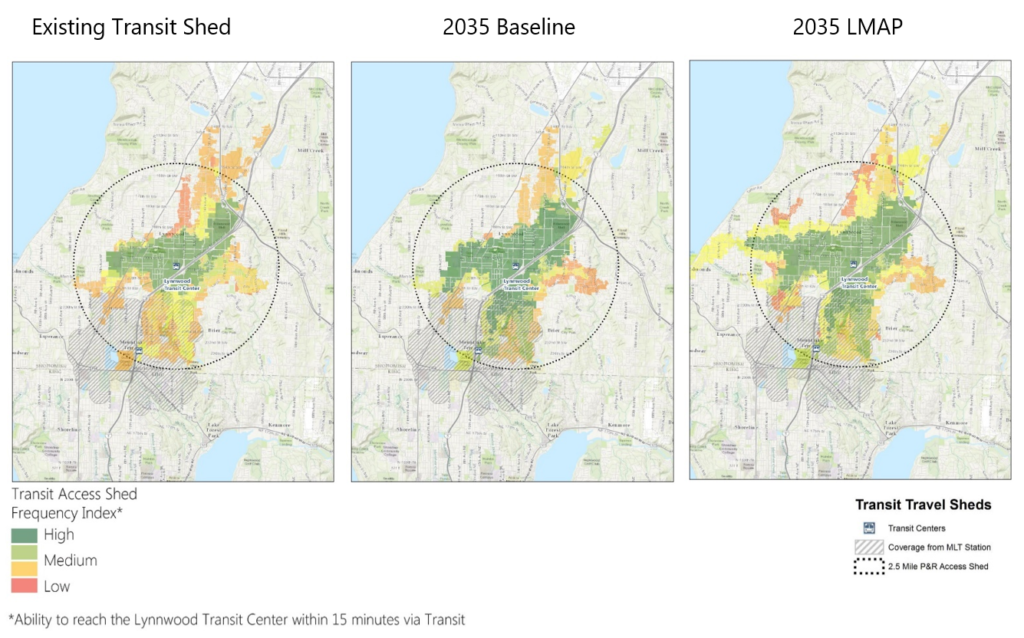
Case Study: Lynnwood Transit Center Multimodal Accessibility Plan (2016)
Population and number of jobs within ½ mile, or other set distance, of a transit stop can be a key indicator of how accessible transit is for different users. This metric can have variations depending on the project type. For example, the Lynnwood Transit Center Multimodal Accessibility Plan considered the number of people, jobs, and college students located within a 15-minute bus ride from the station as one of the measures within the transit access category. This project was assessing a transit center, and thus it was considered important to measure how well people could connect to jobs and other destinations from the center with transit.
To learn more, refer to the final report for the Lynnwood Transit Center Multimodal Accessibility Plan.
- What? A measure of transit service frequency.
- Why? Frequency of transit service defines the availability of transit at different times during the day. This is an important factor for people deciding whether transit is convenient for them. It is a general metric, since it doesn’t account for where people want to go, but it provides a good indicator of transit availability.
- Where? This metric applies only to areas that have transit service.
- How? Coordinate with local transit agencies to identify the applicable transit routes and service frequencies. Transit capacity should also be considered in locations where ridership is very high or where capacity is limited, such as on ferries that are frequently crowded during high tourist season.
Please refer to the Transit Rider Quality of Service measure for a related metric. Also refer to the Multimodal Capacity Usage measure if transit vehicle capacity is a constraint.
| METRIC | SOURCES | DATA | ANALYSIS SOFTWARE | CALCULATION | RESOURCES |
|---|---|---|---|---|---|
| Frequency of transit service | Transit agencies WSDOT GeoData Distribution Catalog | Transit network map and schedule | GIS program Spreadsheet program | Document frequency of transit service at different time periods within study area | Transit agency data WSDOT GeoData Distribution Catalog |
Case Study: SR 16: Tacoma Narrows Bridge to State Route 3, Congestion Study (2018)
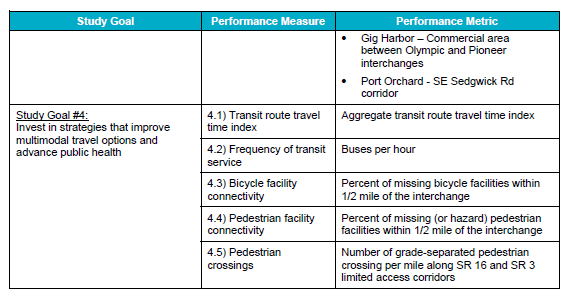
The frequency of transit service within a designated study area or as it connects to a designated project can help identify where potential investments or changes in service could be made. The SR 16: Tacoma Narrows Bridge to SR 3 Congestion Study considered the frequency of transit service,, as shown in the table below.
To learn more, visit the project website for the SR 16: Tacoma Narrows Bridge to SR 3 Congestion Study.
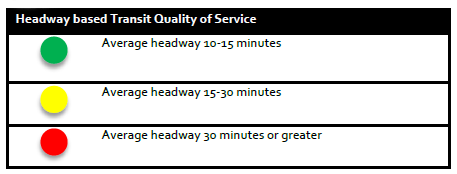
This metric was also used to rate the quality of transit service as part of the Lynnwood Transit Center Multimodal Accessibility Plan. When ranking project alternatives, they used the dot ratings below to denote the quality of service.
Visit the project website for the Lynnwood Transit Center Multimodal Accessibility Plan.