This measure analyzes the accessibility to major destinations such as retail and employment centers, institutions, services, tourist attractions, recreational areas, and calculate travel time by vehicle, transit, bicycle, or walking.
| PERFORMANCE MEASURE | PERFORMANCE METRICS | PROJECT TASKS | APPROPRIATE CONTEXTS |
|---|---|---|---|
| Major Destinations Accessible | Access to jobs by driving, transit, biking, and walking (Access Score Work) | Assess Alternative Strategies Refine Solutions Assign Resources | Urban Core Town/Urban Suburban Rural* |
| Access to non-work destinations by driving, transit, biking, and walking (Access Score Non-Work) | Assess Alternative Strategies Refine Solutions Assign Resources | Urban Core Town/Urban Suburban |
|
| *sometimes applicable, refer to metric description for more detail | |||
- What? Ease of access to jobs by different modes. Analyze each mode separately.
- Why? Better access to jobs provides improved mobility for workers. Note that these metrics can be evaluated for specific demographic groups (e.g., by age, race income etc.).
- Where? This metric is useful for conducting corridor/subarea studies in more urban settings where a variety of modes may be available, and in some rural settings where access via driving is the primary mode.
- Considerations: Care should be taken for applications in rural areas, because the Census geographies used to analyze accessibility (block groups) are large in rural areas, which makes the analysis less sensitive to the effects of transportation networks. Before choosing this measure, open the Census block group GIS layer to see if the unit of analysis makes sense for the area you are evaluating.This metric may be most useful in medium-sized towns or larger, or to evaluate accessibility between rural areas and a nearby urban center.
- How? Analysts can review the transportation network and job destinations and measure travel times using Sugar Access. A more fine-grained analysis can be conducted by adjusting the Cube Access modal networks to reflect local conditions. For example, in rural or suburban areas, there may be informal walking and biking connections that do not show up in the Cube Access network.
- Pedestrian considerations: For pedestrian analysis, adjustments to the typical Cube Access walk or bicycle speeds may be appropriate, with a resulting change in accessibility. In places with high numbers of older adults and people with disabilities, analysts should assume that people walk slower than the typical 4.6 feet per second/3.1 miles per hour. High vehicle speeds and volumes make walking less comfortable and create barriers to pedestrian crossings, forcing people to walk out of their way to reach a safe place to cross or to walk on a more pleasant street. Streets with speed limits of 30 mph or higher with multiple travel lanes can decrease average walking speeds by up to 50 percent. Similarly, bicyclists in areas with high vehicle speeds may go out of their way to use a more comfortable street or safer crossing, reducing their average speed.
| METRIC | SOURCES | DATA | ANALYSIS SOFTWARE | CALCULATION | RESOURCES |
|---|---|---|---|---|---|
| Access to jobs by driving, transit, biking, and walking (Access Score Work) | Sugar Access Field-collected data on pedestrian and bicycle facilities | Roadway network shapefiles | Sugar Access | Access by mode | Sugar Access |
Case Study: Caltrans’s Smart Mobility Framework (2010)
Access to jobs is a metric used to measure how projects connect people to the places they need to go. Travel time or distance can be used to measure accessibility for different modes. Caltrans’s Smart Mobility Framework (2010) includes a wide range of performance measures and emphasizes that their relative priority should vary depending on facility (e.g. freeway, arterial, local roadway, etc.) and place type (urban vs suburban vs rural). Accessibility and Connectivity is one performance measure, defined as the number of households within a 30-minute transit ride of major employment center, within a 20-minute auto ride of employment, or within walking distance of schools. The report states that this performance measure is important for arterial evaluations in most urban and suburban place types. To learn more, please see the final report for the Caltrans Smart Mobility Framework.
- What? Ease of access to various non-work destinations by different modes. Analyze each mode separately.
- Why? Non-work trips make up approximately 80% of all trips that people make. As a result, better access to points of interest, like schools, stores, personal services, medical providers, or recreation sites provides improved mobility.
- Where? This metric is useful for conducting corridor/subarea studies in both urban and rural portions of the state.
- How? Analysts can review the transportation network and non-work destinations and measure travel times using Cube Access. The tool can evaluate how well different travel modes access destinations and to identify gaps in needed services. For example, an analysis of access to supermarkets can identify ‘food deserts’ where people have limited access to healthy food.
- Customizing modal networks: As with the Access to jobs metric, analysts may choose to adjust the Cube Access modal networks to reflect local conditions. For example, in rural or suburban areas, there may be informal walking and biking connections that do not show up in the Cube Access network.
- Pedestrian considerations: For pedestrian analysis, adjustments to the typical Cube Access walk or bicycle speeds may be appropriate. Places with high numbers of older adults and people with disabilities will have slower average walking speeds than the typical 3.0 feet per second. Analysts may also want to reduce average walking and bicycling speed in locations where streets have high vehicle speeds and volumes. These streets make walking and bicycling less comfortable and create barriers to crossing, forcing people to go out of their way to reach a safe place to cross or to travel on a more pleasant street.
| METRIC | SOURCES | DATA | ANALYSIS SOFTWARE | CALCULATION | RESOURCES |
|---|---|---|---|---|---|
| Access to non-work destinations by driving, transit, biking, and walking (Access Score Non-Work) | Sugar Access Field-collected data on pedestrian and bicycle facilities | Roadway network shapefiles | Sugar Access | Access by mode | Sugar Access |
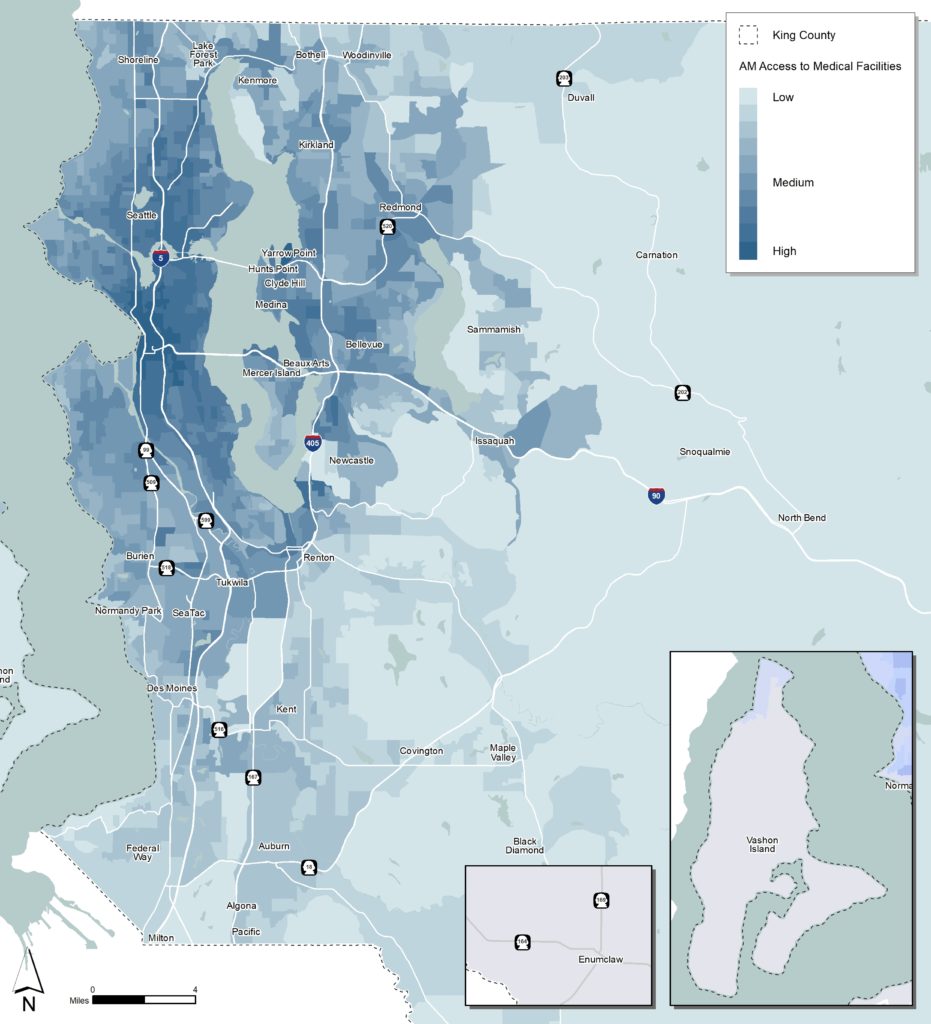
Case Study: King County Metro Mobility Framework (Ongoing)
Access to non-work destinations is a metric used to measure how projects connect people to the places they need to go. Travel time or distance can be used to measure accessibility for different modes. King County Metro’s Mobility Framework, which is still in development as of June 2019, is evaluating how current transit service is provided throughout King County and how that service impacts access to opportunity. The analysis incorporates scheduled travel times, including walking, waiting, and transferring. The framework is evaluating several metrics associated with accessibility, including non-work destinations such as housing support services and medical facilities.
The associated map shows different levels of access by highlighting the relative number of medical facilities that are reachable via transit within 60 minutes.