Travel time variability informs the decision to use a specific mode and provides insight into how well a specific mode is served by the transportation network. Reliability is normally analyzed for existing conditions, since forecasting future reliability by mode is difficult.
Washington State has set performance targets for person miles traveled (PMT) on WSDOT facilities that are reliable and the Truck Travel Time Reliability Index among its MAP-21 performance measures. For more information, refer to the Map-21 & System Performance, Freight Management and CMAQ folio.
| PERFORMANCE MEASURE | PERFORMANCE METRICS | PROJECT TASKS | APPROPRIATE CONTEXTS |
|---|---|---|---|
| Modal Reliability | Travel time reliability | Identify Needs Assess Alternative Strategies Refine Solutions Assign Resources | Urban Core Town/Urban Suburban* Rural* |
| Ferry reliability | Assess Alternative Strategies Refine Solutions Assign Resources | Urban Core* Town/Urban* Suburban* |
|
| Percent transit on-time | Refine Solutions Assign Resources | Urban Core Town/Urban Suburban* |
|
| *sometimes applicable, refer to metric description for more information | |||
- What? This metric evaluates variability in travel time compared to free-flow travel time.
- Why? Variability in travel time compared to free-flow travel time identifies how much traffic congestion and other operational issues affect the usability of a mode.
- Where? This metric is most applicable for project- and corridor-level studies in urban and suburban settings that experience traffic congestion.
- How? This metric compares the ratio of average peak travel time with maximum throughput speed travel At WSDOT this metric is called the “Maximum Throughput Travel Time Index” (MT3I). The MT3I divides the average peak travel time by the maximum throughput travel time to produce a measure of the relationship between efficient and actual travel times that allows for comparison across routes of different lengths. As the MT3I value increases, travel time performance deteriorates. An MT3I of 1.0 would indicate a highway operating at maximum efficiency. (Source: WSDOT’s Handbook for Corridor Capacity Evaluation, 2nd Edition, November 2016). Travel time data is available from the WSDOT Transportation Data, GIS & Modeling Office.
| METRIC | SOURCES | DATA | ANALYSIS SOFTWARE | CALCULATION | RESOURCES |
|---|---|---|---|---|---|
| Travel time reliability | WSDOT travel time and speed data | Travel time (by mode, if available) during specified peak periods Maximum | Spreadsheet program | Maximum Throughput Travel Time Index (MT3I) | WSDOT’s Handbook for Corridor Capacity Evaluation (2016) WSDOT Transportation Data, GIS & Modeling Office |
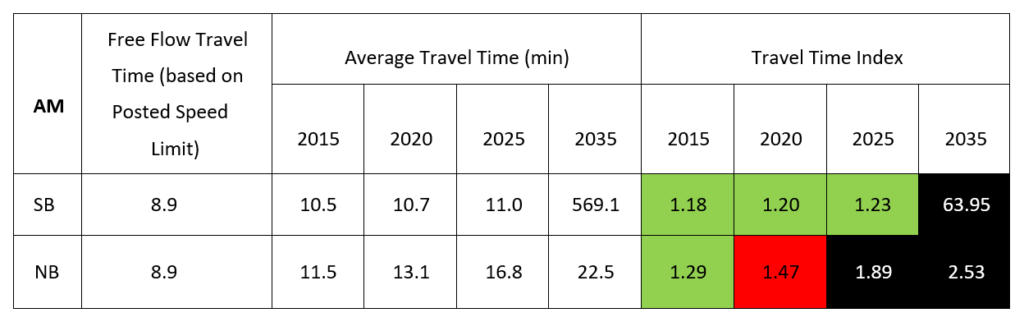
Case Study: SR 162 Sumner to Orting Congestion Study 2017)
Travel time reliability indicates how consistent travel time is for different day parts. Inconsistent times reduces reliability, and as such increases the stress of traveling. Travel time index (TTI) is the common calculation for beginning to understand peak congestion vs. free flow travel time, measuring the ratio of peak hour travel time to free flow travel time. The SR 162 Sumner to Orting Congestion Study noted variation in the TTI is significant, as well as set a threshold for TTI. The travel time reliability threshold was set at 1.5, or 50% higher than free-flow travel time.
To learn more, visit the project website for the SR 162 Sumner to Orting Congestion Study.
- What? Measure of ferry reliability in terms of on-time arrival percentages or number of delays. Ferry reliability can be an indicator for accessibility and ease of use for travel by ferry. Reliability by mode used to access ferry service can also be calculated; a given ferry departure may have no additional capacity for drive-on passengers yet have a great deal of capacity for those who walk or bike on.
- Why? On-time departure and arrivals allow ferries to be a reliable travel mode for system users. On-time performance for the Washington State Ferry (WSF) system is closely related to ridership. High volumes of passengers during peak travel periods, including the summer months, prime travel weekends in spring and fall, and holidays, can affect on-time performance since additional time is needed to load and unload ferries.
- Where? Where ferry service exists and where a proposed project would affect ferry usage or performance.
- How? Reliability can be calculated based on on-time arrivals and departures of ferries. On-time data is available from Washington State Ferries, provided on WSF’s Accountability webpage.
| METRIC | SOURCES | DATA | ANALYSIS SOFTWARE | CALCULATION | RESOURCES |
|---|---|---|---|---|---|
| Ferry reliability | On-time performance data for Washington State Ferries | Percent on-time for specified WSF route | N/A | Percent on time Number of delays per year | WSF Accountability webpage |
- What? Percentage of all transit trips that arrive or depart on time.
- Why? On-time departure and arrivals allow transit to be a reliable mode for system users.
- Where? Where transit service exists and where a proposed project would affect transit usage or performance. Typically focused on fixed-route transit that serves regular routes.
- How? Summarize on-time transit data available from transit agencies or refer to the most recent Washington State Summary of Public Transportation. Please refer to related metrics such as Frequency of transit service and Transit persons carried.
| METRIC | SOURCES | DATA | ANALYSIS SOFTWARE | CALCULATION | RESOURCES |
|---|---|---|---|---|---|
| Percent transit on-time | WSDOT 2017 Summary of Public Transportation Local transit agencies | Local transit agency on-time performance data Modeled transit performance [future conditions] | Spreadsheet program | Percent on-time arrivals and/or departures | WSDOT 2017 Summary of Public Transportation |