The presence and connectedness of pedestrian facilities, such as sidewalks, pedestrian-accessible intersections, and crossings with appropriate controls based on context, provides a quantitative measure of how well a corridor or other facility accommodates pedestrians. This measure is evaluated by determining where sidewalks are missing, whether an adequate pedestrian network is provided, and whether the pedestrian facility is fully ADA-accessible.
| PERFORMANCE MEASURE | PERFORMANCE METRICS | PROJECT TASKS | APPROPRIATE CONTEXTS |
|---|---|---|---|
| Pedestrian Facility Availability & Connectivity | Percent of missing pedestrian facilities within xx mile on each side of corridor segment | Identify Needs Assess Alternative Solutions Refine Solutions | Urban Core Town/Urban Suburban Rural* |
| Pedestrian crossing opportunities per mile | Identify Needs Assess Alternative Solutions Refine Solutions | Urban Core Town/Urban Suburban Rural* |
|
| Intersection density | Identify Needs Assess Alternative Solutions Refine Solutions | Urban Core Town/Urban Suburban |
|
| Percentage of ADA accessible facilities along corridor segments | Manage Assets Refine Solutions | Urban Core Town/Urban Suburban Rural* |
|
| *sometimes applicable, refer to metric description for more detail | |||
- What? Measure of pedestrian facility availability, ADA accessibility, and connectivity.
- Why? Filling in missing pedestrian facilities improves connectivity for pedestrians and improves safety and route directness. This encourages walking as a travel mode; for example, walking to transit stops and ferry landings.
- Where? This is particularly important along high-volume and/or high-speed roads where there is an existing or planned local pedestrian network, a concentration of walkable destinations, a higher percentage of seniors or disabled persons in the area, and/or the presence of households without vehicles. Typically, the analyst should include connecting pedestrian facilities within one-half mile on either side of the roadway. Consider both the primary roadway being analyzed as well as other roadways that run parallel or perpendicular to the highway. This is important, since pedestrians need a network of facilities to have safe accessibility to/from destinations.
- Study types: This metric is most effectively applied for project- or corridor-level studies in situations when the local government has a pedestrian facilities plan that identifies needed links in the pedestrian network. Not every roadway may need full pedestrian facilities due to the surrounding land uses and nature of the roadway.
- How? For the roadways being studied, measure the length of existing pedestrian facilities on each side of the roadway. Divide this length by the total roadway length, which provides the percentage of existing pedestrian facilities. Subtract this total from 100 percent to provide the percentage of missing pedestrian facilities.
- Considerations: Pedestrian facilities should only be counted toward this metric if they are consistent with WSDOT or local agency design standards. Different types of pedestrian facilities (e.g. shoulders, gravel or asphalt, concrete, trails) may be included in the analysis. If facilities do not meet design standards, opportunities to bring them up to those standards should be incorporated in the evaluation of solutions.
- Note: This metric can be evaluated at a higher level of detail and effort by assessing the quality of adjacent pedestrian facilities, the presence and/or quality of ADA-accessible facilities, the degree of separation from traffic, or the amount of streetscape enhancing elements such as street trees. Please refer to Percentage of ADA accessible facilities along corridor segments for a related metric.
| METRIC | SOURCES | DATA | ANALYSIS SOFTWARE | CALCULATION | RESOURCES |
|---|---|---|---|---|---|
| Percent of missing pedestrian facilities within xx mile on each side of corridor segment | WSDOT All Public Roads dataset Sugar Access WSDOT Active Transportation Plan (forthcoming) Field-collected data on pedestrian facilities | Walking network shapefiles (sidewalks and trails) with sidewalk presence and condition information Roadway network shapefiles | GIS program Sugar Access | Street network length Percent of network without pedestrian facilities | Sugar Access |
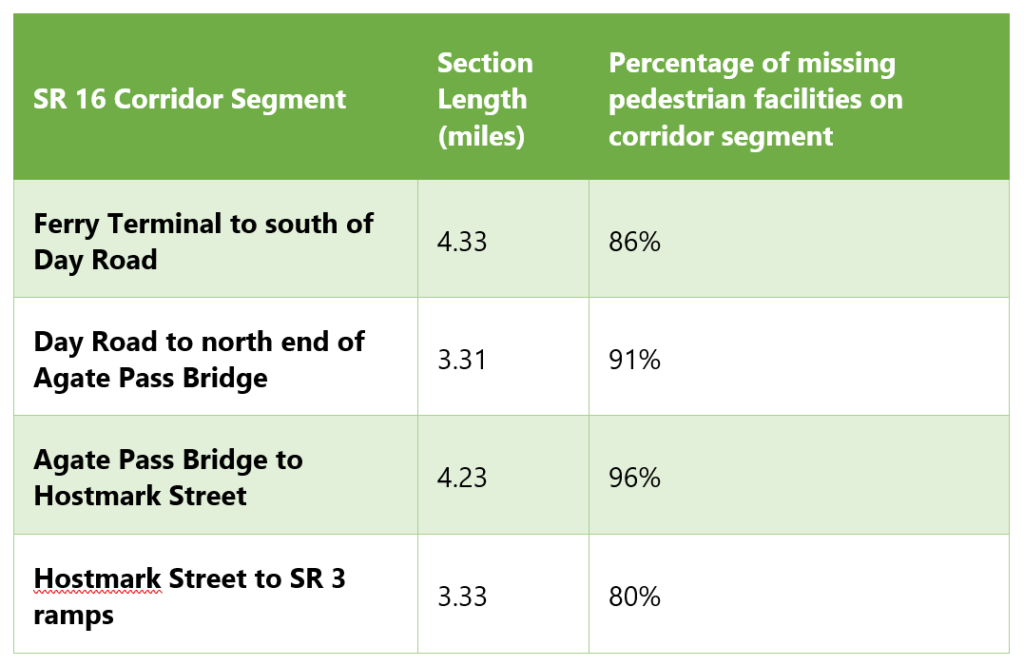
Case Study: SR 305 Corridor Needs and Opportunities Study (2016)
The percent of missing pedestrian facilities within a designated study area measures pedestrian connectivity and access and helps planners identify where potential investments could be made.
The SR 305 Corridor Needs and Opportunities Study considered the percent of missing pedestrian facilities along various sections of the corridor.
Visit the project website for the SR 305 Corridor Needs and Opportunities Study.
- What? A measure of pedestrian connectivity based on how many locations
- Why? Increasing the number of pedestrian crossing opportunities with appropriate controls based on context improves safety and route directness, encouraging walking as a travel mode.
- Where? This metric is typically used for project- or corridor-level studies where there is an existing or planned local pedestrian network, a concentration of walkable destinations, and/or the presence of households without vehicles. Crossings are important where there are destinations that people will want to cross to access and where there are generators of pedestrian activity. This could occur sometimes in rural areas along a higher speed road where there are concentrations of origins and destinations on each side of the roadway.
- How? Within the study area, count the number of pedestrian crossing opportunities with appropriate controls and divide by the mileage of the corridor or subarea. Pedestrian crossings should only be counted toward this metric if they are marked or controlled at the level appropriate for the street, according to WSDOT guidance. WSDOT maintains a Roadway Intersection dataset for State highways, which includes intersection controls. Please refer to the Pedestrian Quality of Service measure for a related metric.
| METRIC | SOURCES | DATA | ANALYSIS SOFTWARE | CALCULATION | RESOURCES |
|---|---|---|---|---|---|
| Pedestrian crossing opportunities per mile | WSDOT WSDOT All Public Roads dataset Project-specific data: Crossing infrastructure for project alternatives | Pedestrian-accessible crossings Type: Sharefile | GIS program Sugar Access | Crossings/mile Note: The Highway Permeability Study (forthcoming, fall 2019) will provide recommended methodology for determining crossing frequency needs. | WSDOT Designing for Pedestrians guidance |
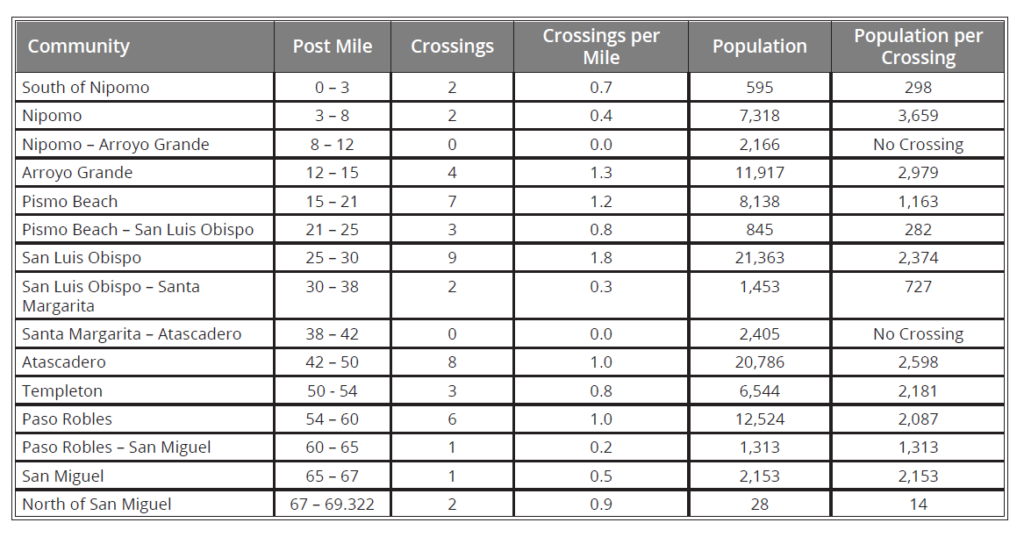
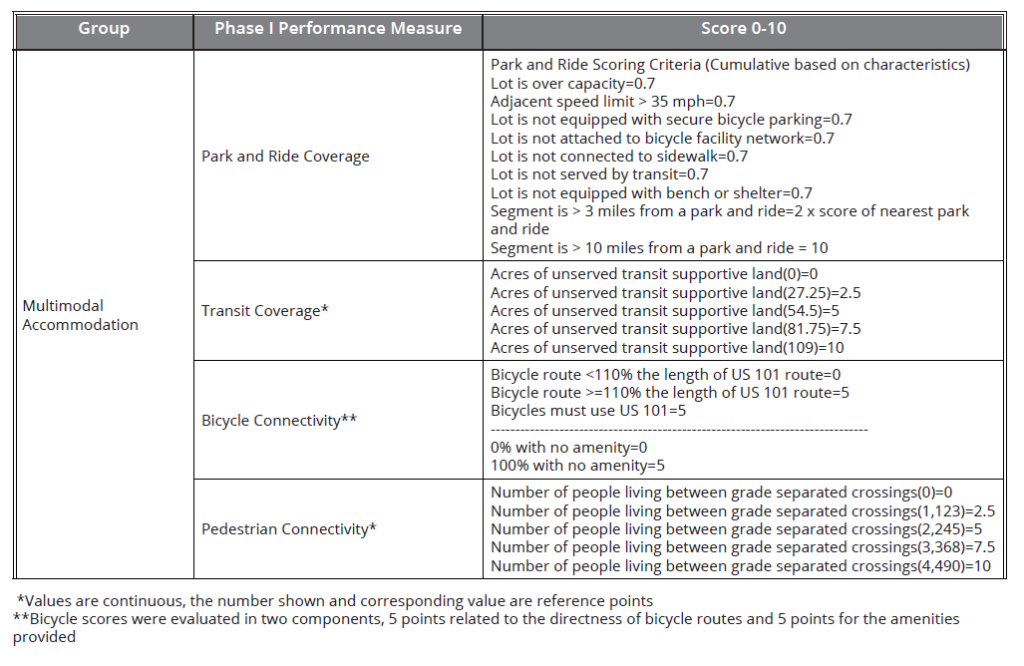
Case Study: San Luis Obispo County’s (CA) US 101 Corridor Mobility Master Plan (2014)
Pedestrian crossings per mile was used in San Luis Obispo County’s US 101 Corridor Mobility Master Plan (2014) to assess improvement needs and address issues of pedestrian connectivity. This measure evaluates pedestrian connectivity along US 101 by measuring distance between grade separated crossings relative to the number of people living between them within ½ mile of the corridor, such as overcrossings with sidewalks, pedestrian bridges, or pedestrian tunnels. Rural areas are therefore not required to have as many crossings as urban areas. Proposed projects were evaluated on a 10-point scale based on the number of people living between grade separated crossings.
To learn more, please see the final report for the US 101 Corridor Mobility Master Plan.
- What? An indicator of network connectivity for pedestrian travel.
- Why? A higher density of intersections provides more walking options for pedestrians to reach destinations.
- Where? Where the metric is most relevant for subareas studies in urban and suburban settings. Land use clusters within rural areas may also have applicability.
- How? Identify a study area within which to calculate the metric. To set the study area, many studies consider a walk shed of ten to fifteen minutes, with an average walking speed of 3.1 miles per hour. Within the study area, calculate the number of intersections and divide by the study area acreage.
- Supplemental data: This calculation of intersection density may be supplemented with other data such as the quality of the pedestrian facilities and crossing opportunities, and the type of intersection control (e.g. signalized, grade-separated etc.).
- Thresholds: While there is no established standard for walkability based on intersection density, research indicates that increased intersection density correlates with increased walking (cited in the US EPA Fact Sheet on Pedestrian-Oriented Street Intersection Density). Please refer to Intersection Density for a related metric.
- Walking speeds: In places with high numbers of older adults and people with disabilities, analysts should assume that people walk slower than the typical 4.6 feet per second/3.1 miles per hour. Please refer to the Access to jobs metric for more information about setting walking speeds.
| METRIC | SOURCES | DATA | ANALYSIS SOFTWARE | CALCULATION | RESOURCES |
|---|---|---|---|---|---|
| Intersection density | WSDOT All Public Roads dataset | Street network and intersections (preferably in shapefile format) Land area (acreage, square miles) | GIS program | Number of intersections divided by covered land area | US EPA Fact Sheet on Pedestrian-Oriented Street Intersection Density |
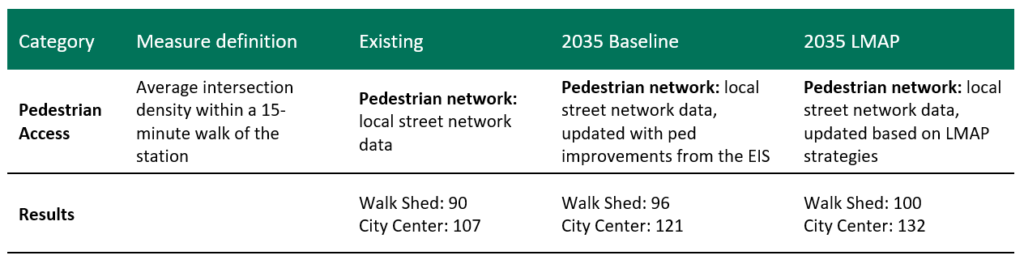
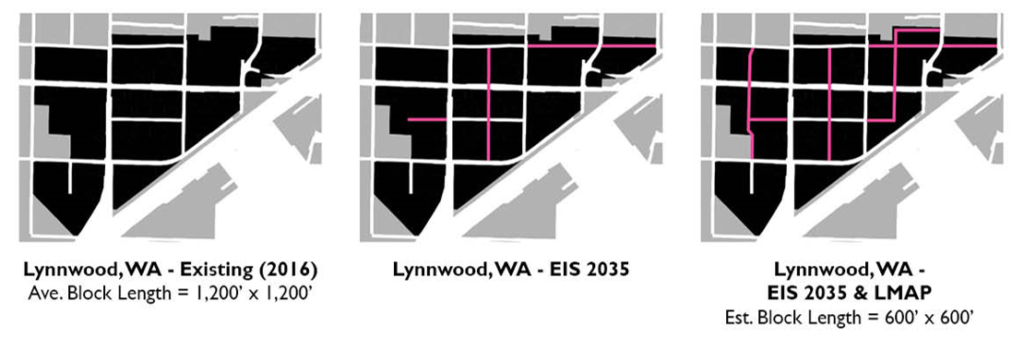
Case Study: Lynnwood Transit Center Multimodal Accessibility Plan (2016)
Intersection density is a measure of pedestrian access. It looks at the number of intersections and their spacing within a determined walk shed or distance from a project or study area and helps to assess directly pedestrians can access their destinations. This metric was used in the Lynnwood Transit Center Multimodal Accessibility Plan (2016) to examine whether people can safely and conveniently walk to the Lynnwood Transit Center. Specifically, the metric used was the average intersection density within a fifteen-minute walk (about 0.6 miles) of the station. Research has showed that this measure is closely correlated with how frequently people walk. It captures strategies that reconfigure the street grid or build new trails.
To learn more, refer to the final report for the Lynnwood Transit Center Multimodal Accessibility Plan.
- What? Measures the quality of pedestrian travel for disabled persons.
- Why? Persons with disabilities need ADA accessible facilities to reach destinations. Providing ADA-accessible connections provides universal access and fulfills the requirements of federal law addressed in WSDOT’s 2018 ADA Transition Plan (available on WSDOT’s guidance for ADA design homepage).
- Where? This metric is most applicable for project and corridor analysis where land use (pedestrian generators, government facilities, etc.) reflects need for pedestrian facilities and where corridor segments form part of a larger network for active transportation access to goods and services
- How? Review the most recently available ADA transition plan (currently WSDOT’s 2018 ADA Transition Plan) to collect state facility inventory data and local agency ADA inventories. Confirm completeness and accuracy of WSDOT inventory data and supplement as needed. Complete the ADA review for both sides of a roadway.
| METRIC | SOURCES | DATA | ANALYSIS SOFTWARE | CALCULATION | RESOURCES |
|---|---|---|---|---|---|
| Percentage of ADA accessible facilities along corridor segments | WSDOT All Public Roads dataset Local ADA access surveys | ADA-accessible facilities and infrastructure along roadway and intersections | GIS program Spreadsheet inventories | Identify length of walking network and crossings with ADA provisions | WSDOT ADA Transition Plan (2018) WSDOT Self Evaluation Data Spreadsheet |
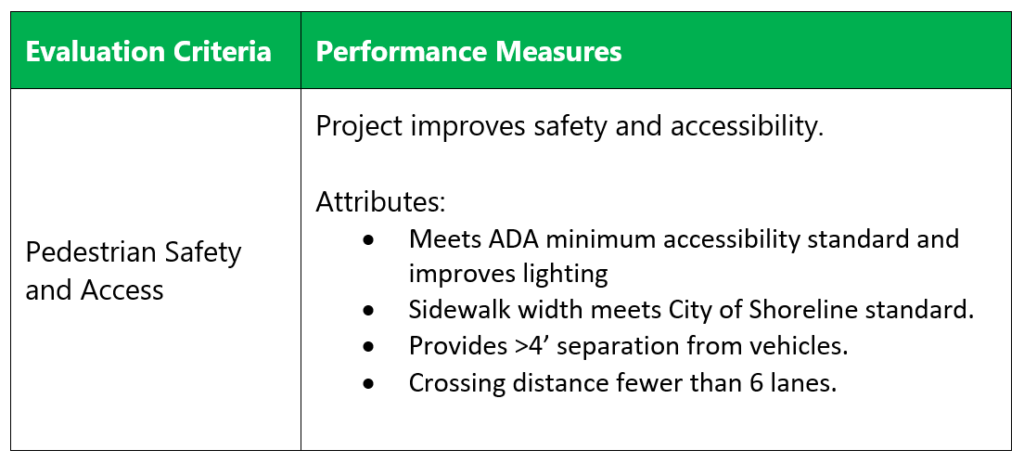
Case Study: Shoreline, WA 145th Street Multimodal Corridor Study (2016)
Corridor studies are opportunities to evaluate how a corridor is serving all modes of transportation and the all people who could be traveling by these various modes. ADA standards can ensure the built environment is a safe and comfortable place for all, and ADA compliance is key for making sure people can access and use any given corridor. The ADA minimum accessibility standard was a key performance measure for evaluating pedestrian safety and access in the City of Shoreline’s 145th Street Multimodal Corridor Study. The table below shows how this measure was incorporated as essential in evaluating the different proposed plans for the corridor.
To learn more, visit the project website for the 145th Street Multimodal Corridor Study.