While travel mode share is determined by many different factors, expanding transportation options, and providing dedicated facilities for walking, biking, and transit allows transportation demand to be spread among multiple travel modes. Evaluating mode share and mode shift potential for current and future conditions can help inform investments in mode-specific facilities. We can use these metrics to help us identify opportunities to close the gap between single occupant car travel and travel by other modes. Often, these are e.g., areas with a dense concentration of destinations, which make walking and biking attractive, and areas where transit travel speeds are competitive with car travel speeds.
| PERFORMANCE MEASURE | PERFORMANCE METRICS | PROJECT TASKS | APPROPRIATE CONTEXTS |
|---|---|---|---|
| Mode Share | Percent mode shares (by mode) | Assess Alternative Strategies Refine Solutions | Urban Core Town/Urban Suburban Rural* |
| Transit mode shift potential (commuter, non-commuter) | Identify Needs Assess Alternative Strategies Refine Solutions | Urban Core Town/Urban Suburban Rural* |
|
| *sometimes applicable, refer to metric description for more information | |||
- What? Determine percentage mode share for trips on a facility or the percentage of total miles traveled by mode within the project study area. May be specific to trips within a specific time period (e.g., PM peak hour) or a specific type of trip (e.g., commute trips).
- Why? Mode share (either observed or modeled) indicates how efficiently the transportation network is accommodating various travel modes. Shifting trips to shared modes such as transit or ridesharing, or to active transportation modes, reduces traffic demand on the roadway system.
- Where? Evaluating mode share is most relevant for corridor and subarea level studies where multiple travel modes are accommodated now or may be accommodated in the future, and where mode shift is needed to improve other metrics such as travel time reliability. While it has direct applicability in urban and suburban settings, mode share metrics can be important in rural areas that are starting to urbanize.
- How? Assess mode share for all trips on a facility or for specific times and/or trip types, using available data. Existing mode shares are available through travel surveys, such as the National Household Travel Survey, and mode share counts. Commute mode share is also available from the American Community Survey. Future mode shares are typically estimated using travel demand forecasting models. Other tools include travel mode elasticities developed from empirical studies and research (e.g., TCRP Report 95, Traveler Response to Transportation System Change and literature surveys sponsored by the California Air Resources Board).
| METRIC | SOURCES | DATA | ANALYSIS SOFTWARE | CALCULATION | RESOURCES |
|---|---|---|---|---|---|
| Percent mode shares | Household travel surveys Counts by mode Transit/vanpool data from transit providers Census journey to work data | Travel survey data Counts by mode Transit ridership data Forecasted mode share (travel model) | Spreadsheet program Travel demand model (forecasted mode share) | Trips by mode divided by all trips | American Community Survey (commute mode share) National Household Travel Survey Household travel survey data from regional planning agency Local transit agencies (transit ridership data) Local agencies (bicycle and pedestrian counts) TCRP Report 95 |
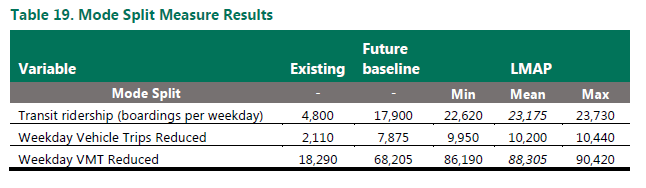
Case Study: Lynnwood Transit Center Multimodal Accessibility Plan (2016)
Mode share percentages can show how a project or corridor serves people traveling by different modes. One example of this metric was for the Lynnwood Transit Center Multimodal Accessibility Plan (LMAP). The table below shows how the LMAP project resulted in an increase in transit ridership (and mode share), which translated into a reduction in vehicle trips and a reduction in vehicle miles traveled (VMT)
Visit the project website for the Lynnwood Transit Center Multimodal Accessibility Plan.
- What? Measure of potential mode shift from driving to transit for commute and non-commute trips. To begin to estimate the potential mode shift from driving to transit, one needs to measure destination access via transit and via driving alone.
- Why? Shifting more users from driving alone to riding transit has the potential to improve the efficiency of the transportation network, increase the number of people per unit of available capacity, and reduce greenhouse gas emissions.
- Where? Locations where transit service exists or is planned within a corridor or subarea, and locations transit service could address latent demand.
- How? Use the Cube Access Mode Shift Potential tool to calculate and compare access to jobs (commuter) and non-work destinations (non-commuter) by transit and driving. The specific calculation divides the transit access score to jobs (or non-work destinations) by the driving access score. The higher the resulting transit/driving access ratio (or percent), the higher is the transit mode shift potential. This tool does not produce an actual mode shift but identifies where there is a higher likelihood of people switching from driving to transit. Cube Access can be used to test different scenarios, such as providing new transit network links (i.e., shorter travel distance for transit) or transit priority treatments (i.e., shorter transit travel times).
While this metric defined in Cube Access is focused on transit mode shift potential, similar comparisons of access scores between driving and active transportation modes could identify opportunities where improvements in active transportation infrastructure could influence pedestrian and bicyclist mode shifts. New research on the effects of non-motorized accessibility on mode shift is being conducted by the State Smart Transportation Initiative (SSTI), which has been assisting WSDOT on testing the Cube Access tool.
If Cube Access is not available, high-level estimates of mode shift potential can be conducted with reference to relevant research, including the California Air Resources Board’s research on the impacts of transportation and land use-related policies.
| METRIC | SOURCES | DATA | ANALYSIS SOFTWARE | CALCULATION | RESOURCES |
|---|---|---|---|---|---|
| Transit mode shift potential (commuter, non-commuter) | Sugar Access Mode Shift Potential tool | Data on driving and transit access | Sugar Access | Access to destinations by transit divided by access to destinations by driving | Sugar Access Relevant Research |