Motorist quality of service evaluates how well a transportation facility serves people driving or traveling in a personal vehicle. This includes drivers in automobiles as well as truck drivers. Traffic congestion, delay at intersections, and travel time directly affect how accessibly roads serve people making trips in personal vehicles.
| PERFORMANCE MEASURE | PERFORMANCE METRICS | PROJECT TASKS | APPROPRIATE CONTEXTS |
|---|---|---|---|
| Motorist Quality of Service | Hours of traffic congestion | Assess Alternative Strategies Refine Solutions | Urban Core Town/Urban Suburban* |
| Intersection Delay | Identify Needs Assess Alternative Strategies Refine Solutions | Urban Core Town/Urban Suburban Rural* |
|
| Travel time (speed), automobile, transit | Identify Needs Assess Alternative Strategies Refine Solutions | Urban Core Town/Urban Suburban* Rural* |
|
| *sometimes applicable, refer to the metric description for more information | |||
- Why? Traffic congestion makes travel by auto less convenient.
- Where? This metric is most relevant for project- and corridor-level analyses on major limited-access highways that experience traffic congestion in urban and suburban locations.
- How? Hours of congestion refers to the cumulative number of hours per day where traffic conditions meet or exceed an established Level of Service threshold. For WSDOT the threshold is 75% of posted speeds (about 45 mph). Calculate existing traffic conditions using established WSDOT roadway speed and density data through the Transportation Data, GIS & Modeling Office or from the National Performance Management Research Data Set (NPMRDS), available at the Federal Highway Administration’s Operations Performance Measurement Program website.
To assess future conditions, use a combination of travel forecasting models and traffic operations models to calculate the distribution of congestion. Most available data capture recurring congestion, and there are good trend data showing daily, monthly, and seasonal variations. These data are normally sufficient for corridor or subarea studies. Big data from cell phones and/or GPS devices can be used to examine non-recurring congestion, since these data are compiled on a 24/7 basis. Traffic flow data can be checked against known non-recurring events, such as a major collision or sporting event.
| METRIC | SOURCES | DATA | ANALYSIS SOFTWARE | CALCULATION | RESOURCES |
|---|---|---|---|---|---|
| Hours of traffic congestion | NPMRDS WSDOT Transportation Data, GIS & Modeling Office | Roadway speed data Vehicle density data | NPMRDS Analytics - Congestion scan tool [existing conditions] Travel demand model (future conditions) | Hours of congested travel per day | WSDOT Transportation Data, GIS & Modeling Office Federal Highway Administration’s Operations Performance Measurement Program website |
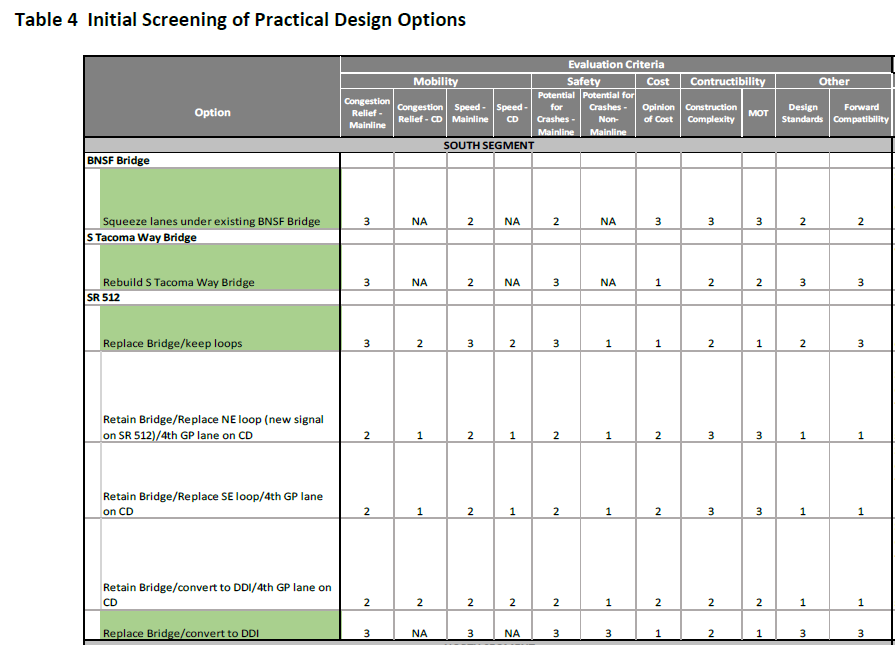
Case Study: I-5 JBLM to South 38th HOV Feasibility Study
Hours of traffic congestion can be used to understand vehicle operations along a corridor or in a given study area. This metric helps to measure the quality of vehicle service. Variations on hours of traffic congestion include hours of delay experience collectively along vehicles using the roadway or roadways. Congestion relief was used as a mobility criterion in the I-5 JBLM to South 38th HOV Feasibility Study, as shown in the table below.
To learn more, review the Technical Report for the I-5 JBLM to South 38th HOV Feasibility Study.
- Why? Delay at intersections makes travel less convenient by personal vehicle.
- Where? This metric is most relevant for project- and corridor-level analyses on facilities that experience traffic congestion, typically in urban, town center, and suburban locations. It may also be relevant in rural
- How? Intersection delay is calculated using equations from the Highway Capacity Manual, published by the Transportation Research Board of the National Academies. Since these equations are highly complex and require many different data inputs, analysts typically use dedicated traffic analysis tools to calculate intersection LOS. WSDOT provides technical guidance for evaluating intersection delay. WSDOT’s Traffic Analysis webpage provides links to download WSDOT’s Traffic Manual (2018) and information about traffic analysis software.
| METRIC | SOURCES | DATA | ANALYSIS SOFTWARE | CALCULATION | RESOURCES |
|---|---|---|---|---|---|
| Intersection Delay | Intersection turning movement counts WSDOT and local jurisdiction signal timing plans Field observations of lane geometry | Vehicle volumes Traffic control data, including signal timing plans | Traffic operations model [existing and future conditions] | Intersection level of service calculations for signalized and unsignalized intersections | WSDOT’s Traffic Analysis webpage WSDOT’s Traffic Manual (2018) Highway Capacity Manual |
- What? Travel time (or speed) for vehicles on the roadway, by roadway segment.
- Why? Reduced travel time (or increased relative speed) on existing facilities provides people in vehicles with improved access to destinations. Reduced transit
- Where? Relevant in all contexts, but particularly on major arterials and limited access facilities.
- How? To calculate existing conditions, travel time (speed) data are available from WSDOT’s Transportation Data, GIS & Modeling Office, from the National Performance Management Research Data Set (NPMRDS), available at the Federal Highway Administration’s Operations Performance Measurement Program website, or from private traffic analytics vendors such as INRIX. WSDOT provides data on transit travel times and speeds via the WSDOT-Transit Stops dataset, hosted on the Washington Geospatial Open Data Portal. Local transit agencies may be able to provide additional data on transit travel times and speeds.
To assess future conditions, typically use a combination of travel demand models and traffic analysis modeling software to estimate travel time and/or speed on the network. WSDOT’s Traffic Analysis webpage provides links to download WSDOT’s Traffic Manual (2018) and information about traffic analysis software.
Note that travel time is not comparable from one roadway to another unless the length and posted speed are the same. Therefore, it is important to establish thresholds as to the targeted travel time, travel speed or percent of posted speed for a corridor. WSDOT typically references 70% of posted speed as a target threshold.
| METRIC | SOURCES | DATA | ANALYSIS SOFTWARE | CALCULATION | RESOURCES |
|---|---|---|---|---|---|
| Travel time (speed), automobile, transit | WSDOT travel time and speed data NPMRDS or other big data product Transit schedules or real-time transit performance data | Travel time (speed) by roadway segment Data by mode, if available | Travel demand models Traffic operations model [existing and future conditions] | Average segment speed (miles per hour), for each roadway segment | WSDOT Transportation Data, GIS & Modeling Office Federal Highway Administration’s Operations Performance Measurement Program website WSDOT-Transit Stops dataset WSDOT’s Traffic Analysis webpage |
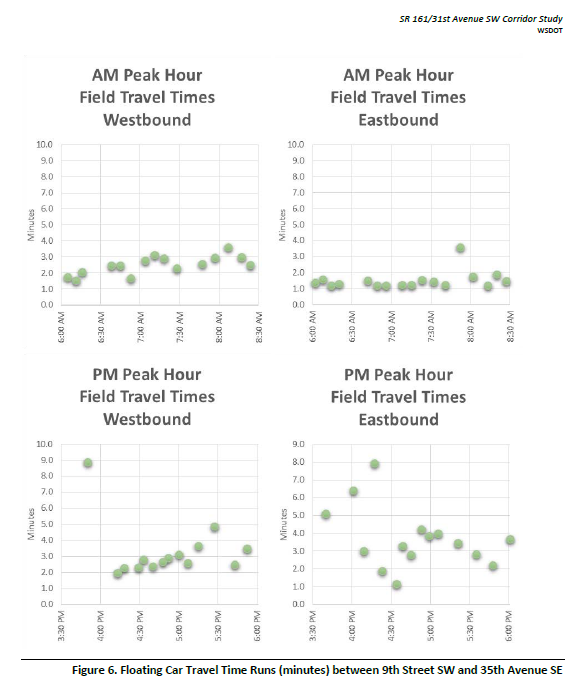
Case Study: SR 161 / 31st Avenue SW Corridor Study (2018)
Travel time or speed for both automobiles and transit can be used as a metric to understand traffic operations along a corridor or in a given study area. This metric helps to measure the quality of vehicle service and of transit service where applicable. Corridor travel time was a key metric in the SR 161 / 31st Avenue SW Corridor Study to compare traffic operations in different project alternatives. The graphic presented shows travel time variation in the PM peak period, representative of the queuing and congestion that occurs.
To learn more, visit the project website for the SR 161 / 31st Avenue SW Corridor Study.