WSDOT uses Bicyclist Level of Traffic Stress (LTS) to measure comfort and exposure to traffic for people bicycling.
| PERFORMANCE MEASURE | PERFORMANCE METRICS | PROJECT TASKS | APPROPRIATE CONTEXTS |
|---|---|---|---|
| Bicycle Quality of Service | Level of bicycle stress | Refine Solutions | Urban Core Town/Urban Suburban Rural* |
| *sometimes applicable, refer to metric description for more information | |||
- What? Bicyclist Level of Traffic Stress (LTS) on a roadway, as measured by the extent to which bicyclists are traveling near high-volume and high-speed auto traffic and the degree of separation provided by bicycle facilities.
- Why? People are more likely to bicycle in places with slow-moving and low volume automobile traffic and where bicyclists are provided with dedicated or separated facilities. Locations that don’t currently meet these criteria may nonetheless need bicycle facilities because a given segment provides network connectivity, and bicyclist use of state right-of-way is allowed everywhere that it is not explicitly barred.
- Where? This metric can be applied on any facility along which bicyclists are desiring to travel. It can also be addressed within a roadway network serving multiple origins and destinations. Typically it will be most relevant in urban and suburban areas, but it may also be relevant for rural locations with high numbers of bicycle trips.
- How? The Bicyclist LTS assesses roadway qualities such as roadway posted speed, roadway width, roadway volume, terrain, and shoulder presence (i.e., rural areas only, where shoulder may provide the only pedestrian connection). Bicycle facilities should meet WSDOT facility standards as defined in the WSDOT Design Manual. Existing Bicycle Level of Traffic Stress is evaluated on roadways in Washington and available from the WSDOT GeoData Distribution Catalog. the Active Transportation Plan will calculate bicyclist LTS for all state highways except where bicycling is explicitly banned on a few limited-access segments. The analysis should consider where bicycle facilities exist or are planned as part of the local community’s planning process.
| METRIC | SOURCES | DATA | ANALYSIS SOFTWARE | CALCULATION | RESOURCES |
|---|---|---|---|---|---|
| Level of bicycle stress | WSDOT GeoData Distribution Catalog Sugar Access | Bicycle and roadway network shapefile data, including bike facility type, bike facility width, roadway quality, parking presence, traffic volumes, and traffic speeds | Sugar Access Spreadsheet program | Level of bicycle stress (multi-step calculation) | WSDOT GeoData Distribution Catalog WSDOT Design Manual |
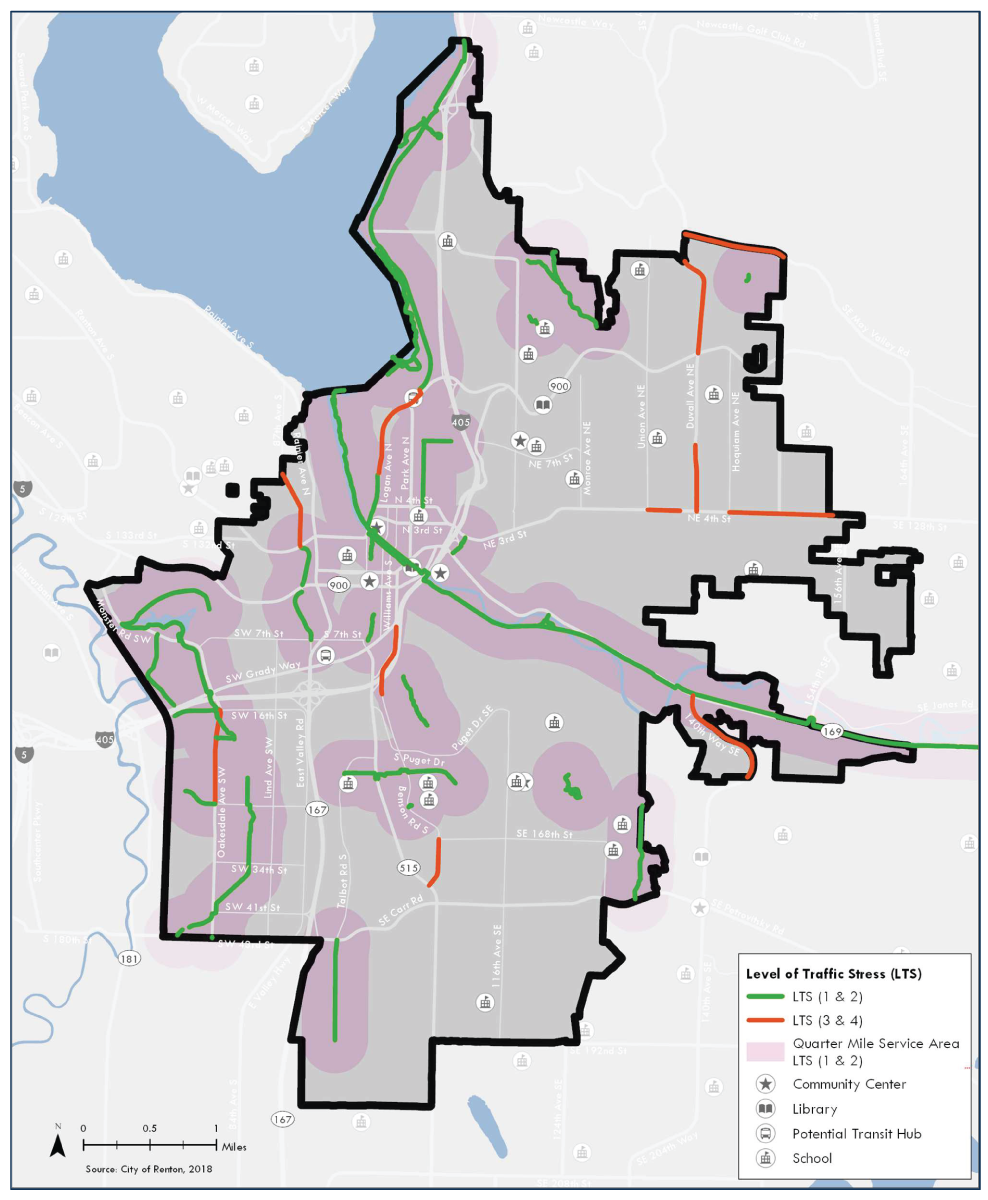
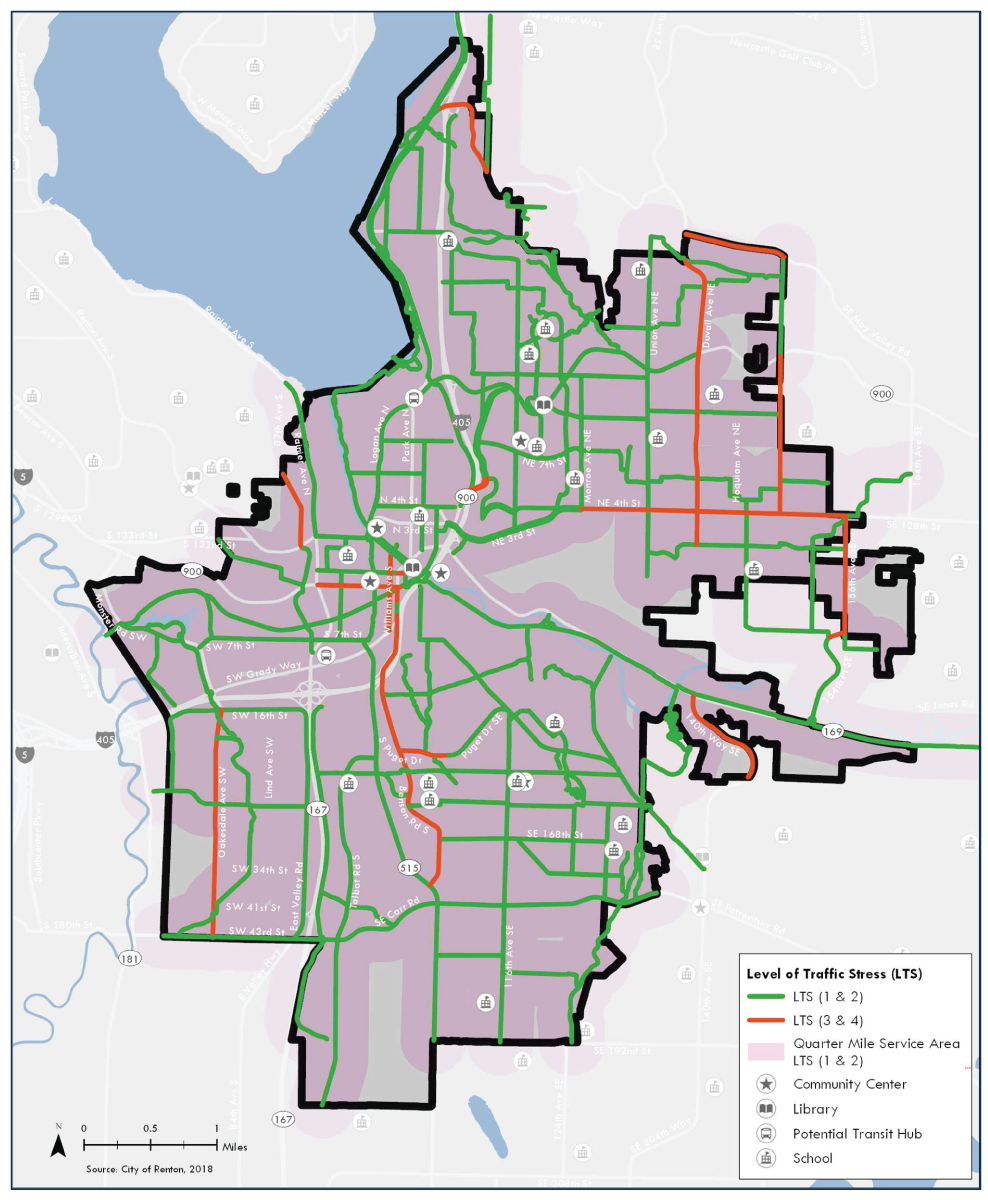
Case Study: Renton Trails and Bicycle Master Plan (2019)
Projects that consider active transportation modes (i.e. walking and bicycling) often rely on level of stress to understand how the project serves bicyclists. Bicycle level of stress was used by the Renton Trails and Bicycle Master Plan (2019) to assess improvement needs and address bicycle connectivity issues. The maps below show how far bicyclists can travel on low stress facilities and the quarter mile service area around those facilities. The projects outlined in the plan greatly expand upon the areas of the City that bicyclists of all ages and abilities would feel comfortable riding on, nearly covering the entire city.
To learn more, please see the final report from the Renton Trails and Bicycle Master Plan.